 +918421517810
 +442921251543


+918421517810
+442921251543
Global Submarine Cable System Market 2021
Type: PDF
Status: Syndicate
Categories: Semiconductor And Electronics
Report Code : SE21124
No. of Pages : 150
The global submarine cable system market size is expected to reach USD XXX billion by 2025 from USD XXX billion in 2020 at an 11.1% CAGR. The growth of the submarine cable system industry can be attributed to the surge in global bandwidth demand, increasing internet connection worldwide, rising new offshore wind capacity additions, and growing demand for inter-country & island connections.
The power cable segment is expected to hold a larger share of the submarine cable system market during the forecast period
Governments of different countries across the world are focusing on increasing their electricity generation output from renewable sources of energy. Offshore wind farms have emerged as an integral part of the renewable power generation capacity of countries. Increasing investments in the development of offshore wind projects globally are expected to drive the demand for submarine power cables during the forecast period
The installation and commissioning segment to be the largest contributor to submarine communication cable market during the forecast period
Rising Internet traffic in APAC owing to a surge in Internet usage is fueling the requirement for increased bandwidth across the region. APAC is likely to witness a rise in the installation & commissioning of new submarine communication systems during the forecast period. Moreover, increasing Internet penetration across the Middle East & Africa is expected to boost the installation & commissioning of submarine communication cables further in the coming years.
Offshore wind power generation to grow at highest CAGR during the forecast period
According to the Global Wind Energy Council (GWEC), the UK is the world’s largest offshore wind market and accounted for a share of ~34% of the global installed wind energy capacity in 2019. It was followed by Germany, which accounted for a share of ~28% of the total installed capacity in the same year. China accounted for a share of ~20% of the global offshore installed capacity of wind energy in 2019. Moreover, countries such as the UK, Germany, China, Japan, and Taiwan plan to invest significantly to expand and develop their regional offshore wind energy industry. These factors are expected to fuel the demand for submarine power cables for offshore wind power generation during the forecast period.
Trans-Atlantic to continue to hold the largest market share of submarine communication cable during the forecast period
Submarine cable routes in Trans-Atlantic are the most competitive across the world. New submarine communication cable laying projects are being planned in the Trans-Atlantic region owing to the increasing bandwidth requirements and growing demand for low latency communication. As such, companies are investing in the region for upgrading existing networks and developing new infrastructures. OTT providers continue to focus on building new infrastructure across the Trans-Atlantic region.
Key Market Players
Alcatel-Lucent, SubCom, NEC, Prysmian, Nexans, Google, Saudi Ericsson, Hengtong, ZTT, NKT, and JDR Cable are among the major players in the submarine cable system market.
Alcatel-Lucent offers services related to submarine cable systems through its Alcatel-Lucent Submarine Networks (ASN). ASN leads the industry in terms of transmission capacity and installed base. It has deployed over 600,000 km of optical submarine cables globally to date. It has an extensive service portfolio comprising project management and installation and commissioning services. ASN also carries out marine and maintenance operations through its fleet of cable ships. This indicates the focus of the company on achieving organic growth.
Scope Of The Report
Market size availability years
2017–2026
Base year
2020
Forecast period
2021–2026
Forecast units
Value (USD) in million / billion
Segments covered
Submarine Communication Cable Market
- Offering: Installation & Commissioning, Maintenance, and Upgrades
- Component: Wet Plant Products and Dry Plant Products
Submarine Power Cable Market
- Type: Single Core and Multicore
- Voltage: Medium Voltage and High Voltage
- End User: Offshore Wind Power Generation, Inter-Country & Island Connection, and Offshore Oil & Gas
Regions covered
Submarine Communication Cable Market
- Region: Trans-Atlantic, Trans-Pacific, Intra-Asia, the Americas, Europe-Asia, and EMEA
Submarine Power Cable Market
- Region: Europe, APAC, North America, the Middle East & Africa, and South America
Companies covered
Alcatel-Lucent, SubCom, NEC, Prysmian, Nexans, Google, Saudi Ericsson, Hengtong, ZTT, NKT, JDR Cable, Corning Inc, Cablel Group, Hesfibel, Okonite, Apar Industries, AFL, TF Kable, and Hexatronic Cables & Interconnect Systems
Submarine Cable System Market Segmentation:
The global submarine cable system market, in this research report, has been segmented mainly based on application: Power Cables and Communication Cable
By Component
- Wet Plant Products
- Dry Plant Products
By Offering:
- Installation & Commissioning
- Maintenance Others
- Upgrades
By Type:
- Single Core
- Multicore
By Voltage:
- Medium Voltage
- High Voltage
Critical questions the report answers
- Where will all the developments take the industry in the mid to long term?
- What are the different regions/routes that are expected to drive the demand for submarine cable system during the forecast period?
- Which are the key strategies adopted by leading companies in the submarine cable system market?
- What are the trends prevalent in the submarine cable system market?
- Which end user industries are expected to drive the submarine power cable market in the next five years?
List of Tables (62 Tables)
Table 1 Submarine Cable System Market, By Application, 2017–2025 (USD Billion)
Table 2 Submarine Communication Cable Market, By Component, 2017–2025 (USD Billion)
Table 3 Submarine Communication Cable Market for Wet Plant Products, By Type, 2017–2025 (USD Million)
Table 4 Submarine Communication Cable Market, By Offering, 2017–2025 (USD Million)
Table 5 Submarine Communication Cable Market for Installation & Commissioning, By Region, 2017–2025 (USD Million)
Table 6 Submarine Communication Cable Market for Maintenance, By Region, 2017–2025 (USD Million)
Table 7 Submarine Communication Cable Market for Upgrades, By Region, 2017–2025 (USD Million)
Table 8 Submarine Power Cable Market, By Type, 2017–2025 (USD Billion)
Table 9 Submarine Single Core Power Cable Market, By Region, 2017–2025 (USD Million)
Table 10 Submarine Multicore Power Cable Market, By Region, 2017–2025 (USD Million)
Table 11 Submarine Power Cable Market, By Voltage 2017–2025 (USD Billion)
Table 12 Medium Voltage Submarine Power Cable Market, By Region, 2017–2025 (USD Million)
Table 13 High Voltage Submarine Power Cable Market, By Region, 2017–2025 (USD Million)
Table 14 Submarine Power Cable Market, By Application, 2017–2025 (USD Billion)
Table 15 Submarine Power Cable Market for Offshore Wind Power Generation, By Region, 2017–2025 (USD Million)
Table 16 Submarine Power Cable Market for Inter-Country & Island Connection, By Region, 2017–2025 (USD Million)
Table 17 Submarine Power Cable Market for Offshore Oil & Gas, By Region, 2017–2025 (USD Million)
Table 18 Submarine Communication Cable Market, By Region, 2017–2025 (USD Million)
Table 19 Submarine Communication Cable Market in Trans-Atlantic, By Offering, 2017–2025 (USD Million)
Table 20 Submarine Communication Cable Market in Trans-Pacific, By Offering, 2017–2025 (USD Million)
Table 21 Submarine Communication Cable Market in Intra-Asia, By Offering, 2017–2025 (USD Million)
Table 22 Submarine Communication Cable Market in Americas, By Offering, 2017–2025 (USD Million)
Table 23 Submarine Communication Cable Market in Europe-Asia, By Offering, 2017–2025 (USD Million)
Table 24 Submarine Communication Cable Market in EMEA, By Offering, 2017–2025 (USD Million)
Table 25 Submarine Power Cable Market, By Region, 2017–2025 (USD Million)
Table 26 Submarine Power Cable Market in North America, By Country, 2017–2025 (USD Million)
Table 27 Submarine Power Cable Market in North America, By End User, 2017–2025 (USD Million)
Table 28 Submarine Power Cable Market in US, By End User, 2017–2025 (USD Million)
Table 29 Submarine Power Cable Market in Canada, By End User, 2017–2025 (USD Million)
Table 30 Submarine Power Cable Market in Mexico, By End User, 2017–2025 (USD Million)
Table 31 Submarine Power Cable Market in Europe, By Country, 2017–2025 (USD Million)
Table 32 Submarine Power Cable Market in Europe, By End User, 2017–2025 (USD Million)
Table 33 Submarine Power Cable Market in UK, By End User, 2017–2025 (USD Million)
Table 34 Submarine Power Cable Market in Germany, By End User, 2017–2025 (USD Million)
Table 35 Submarine Power Cable Market in Denmark, By End User, 2017–2025 (USD Million)
Table 36 Submarine Power Cable Market in Norway, By End User, 2017–2025 (USD Million)
Table 37 Submarine Power Cable Market in Netherlands, By End User, 2017–2025 (USD Million)
Table 38 Submarine Power Cable Market in Rest of Europe, By End User, 2017–2025 (USD Million)
Table 39 Submarine Power Cable Market in APAC, By Country 2017–2025 (USD Million)
Table 40 Submarine Power Cable Market in APAC, By End User, 2017–2025 (USD Million)
Table 41 Submarine Power Cable Market in China, By End User, 2017–2025 (USD Million)
Table 42 Submarine Power Cable Market in Japan, By End User, 2017–2025 (USD Million)
Table 43 Submarine Power Cable Market in South Korea, By End User, 2017–2025 (USD Million)
Table 44 Submarine Power Cable Market in Malaysia, By End User, 2017–2025 (USD Million)
Table 45 Submarine Power Cable Market in Indonesia, By End User, 2017–2025 (USD Million)
Table 46 Submarine Power Cable Market in Rest of APAC, By End User, 2017–2025 (USD Million)
Table 47 Submarine Power Cable Market in Middle East & Africa, By Country, 2017–2025 (USD Million)
Table 48 Submarine Power Cable Market in Middle East & Africa, By End User, 2017–2025 (USD Million)
Table 49 Submarine Power Cable Market in UAE, By End User, 2017–2025 (USD Million)
Table 50 Submarine Power Cable Market in Saudi Arabia, By End User, 2017–2025 (USD Million)
Table 51 Submarine Power Cable Market in Angola, By End User, 2017–2025 (USD Million)
Table 52 Submarine Power Cable Market in Rest of Middle East & Africa, By End User, 2017–2025 (USD Million)
Table 53 Submarine Power Cable Market in South America, By Country, 2017–2025 (USD Million)
Table 54 Submarine Power Cable Market in South America, By End User, 2017–2025 (USD Million)
Table 55 Submarine Power Cable Market in Brazil, By End User, 2017–2025 (USD Million)
Table 56 Submarine Power Cable Market in Argentina, By End User, 2017–2025 (USD Million)
Table 57 Submarine Power Cable Market in Rest of South America, By End User, 2017–2025 (USD Million)
Table 58 Market Ranking of Top 3 Players in Submarine Communication Cable Market in 2019
Table 59 Market Ranking of Top 3 Players in Submarine Power Cable Market in 2019
Table 60 Contracts and Agreements, 2018–2019
Table 61 Acquisitions, 2018–2019
Table 62 Product Launches, 2019
List of Figures (28 Figures)
Figure 1 Submarine Cable System Market Segmentation
Figure 2 Process Flow for Estimation of Submarine Cable System Market
Figure 3 Submarine Cable System Market: Research Design
Figure 4 Data Triangulation Methodology
Figure 5 Submarine Cable System Market, 2017–2025 (USD Billion)
Figure 6 Installation & Commissioning Segment Projected to Hold Largest Share of Submarine Communication Cable Market From 2020 to 2025
Figure 7 Offshore Wind Power Generation Segment of Submarine Power Cable Market Projected to Grow at Highest CAGR From 2020 to 2025
Figure 8 High Voltage Segment of Submarine Power Cable Market Projected to Grow at High CAGR From 2020 to 2025
Figure 9 Submarine Communication Cable Market in Trans-Pacific to Grow at Highest CAGR From 2020 to 2025
Figure 10 Europe Held Largest Share in Submarine Power Cable Market in 2019
Figure 11 Surge in Demand for Increased Bandwidth Driving Growth of Submarine Cable System Market Globally
Figure 12 Power Cables Segment Projected to Lead Submarine Cable System Market From 2020 to 2025
Figure 13 Wet Plant Products Segment to Hold Large Size of Submarine Communication Cable Market From 2020 to 2025
Figure 14 Trans-Atlantic to Hold Largest Share of Submarine Communication Cable Market in 2024
Figure 15 Single Core Segment to Hold Large Share of Submarine Power Cable Market in 2020
Figure 16 Offshore Wind Power Generation Segment and China Held Largest Shares of Submarine Power Cable Market in APAC in 2019
Figure 17 Submarine Power Cable Market in China Projected to Grow at Highest CAGR From 2020 to 2025
Figure 18 Market Dynamics: Overview
Figure 19 Global Annual Cumulative Offshore Wind Capacity, 2011–2018
Figure 20 Submarine Power Cable Market in APAC Projected to Grow at Highest CAGR From 2020 to 2025
Figure 21 Europe: Submarine Power Cable Market Snapshot
Figure 22 APAC: Submarine Power Cable Market Snapshot
Figure 23 Alcatel-Lucent (Nokia): Company Snapshot
Figure 24 NEC: Company Snapshot
Figure 25 Prysmian: Company Snapshot
Figure 26 Nexans: Company Snapshot
Figure 27 Google (Alphabet): Company Snapshot
Figure 28 NKT: Company Snapshot
Table of Contents
1 Introduction (Page No. - 17)
1.1 Study Objectives
1.2 Definition
1.2.1 Inclusions and Exclusions
1.3 Study Scope
1.3.1 Markets Covered
1.4 Years Considered
1.5 Currency
1.6 Stakeholders
2 Research Methodology (Page No. - 20)
2.1 Research Data
2.1.1 Secondary Data
2.1.1.1 Secondary Sources
2.1.2 Primary Data
2.1.2.1 Primary Sources
2.1.2.2 Key Industry Insights
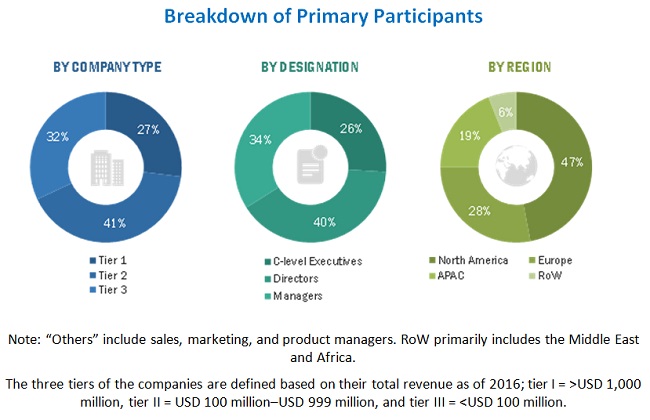
2.1.2.3 Breakdown of Primaries
2.2 Market Size Estimation
2.2.1 Bottom-Up Approach
2.2.2 Top-Down Approach
2.3 Market Breakdown and Data Triangulation
2.4 Research Assumptions
2.5 Study Limitations
3 Executive Summary (Page No. - 28)
4 Premium Insights (Page No. - 33)
4.1 Attractive Opportunities in Submarine Cable System Market
4.2 Submarine Cable System Market, By Application
4.3 Submarine Communication Cable Market, By Component
4.4 Submarine Communication Cable Market, By Region
4.5 Submarine Power Cable Market, By Type
4.6 Submarine Power Cable Market in APAC
4.7 Submarine Power Cable Market, By Country
5 Market Overview (Page No. - 37)
5.1 Introduction
5.2 Market Dynamics
5.2.1 Drivers
5.2.1.1 Surge in Global Bandwidth Demand
5.2.1.2 Increasing Internet Traffic in APAC
5.2.1.3 Increasing Telecom Subscriptions and Internet Connections Worldwide
5.2.1.4 Growing Demand for Inter-Country and Island Power Connections
5.2.1.5 Increasing Number of Offshore Wind Farms
5.2.2 Restraints
5.2.2.1 Regulatory, Environmental, and Complex Authorization Procedures Leading to Delays
5.2.2.2 Entry Barriers for Start-UPS and SMEs
5.2.2.3 Complex Repairing Procedure for Deepwater Power Cable Links
5.2.3 Opportunities
5.2.3.1 Growing Investment in Deployment of High-Capacity Communications Systems By Ott Players
5.2.3.2 Increasing Demand for Hvdc Submarine Power Cables
5.2.4 Challenges
5.2.4.1 Growing Buzz Around Space-Based Internet Communications Constellations
5.2.4.2 Redundant Links, and Natural and Human-Triggered Activities Leading to Disruptions
6 Submarine Cable System Market, By Application (Page No. - 49)
6.1 Introduction
6.2 Communication Cables
6.2.1 Increase in Number of High-Capacity Communication Systems Leading to Rise in Global Demand for Submarine Communication Cables
6.3 Power Cables
6.3.1 Rise in Number of Offshore Wind Farm Installations to Contribute to Demand for Submarine Power Cables Globally
7 Submarine Communication Cable Market, By Component (Page No. - 52)
7.1 Introduction
7.2 Dry Plant Products
7.2.1 Submarine Line Terminal Equipment (SLTE)
7.2.2 Submarine Line Monitors (SLM)
7.2.3 Power Feeding Equipment (PFE)
7.3 Wet Plant Products
7.3.1 Repeaters
7.3.2 Branching Units (BU)
7.3.3 Cables
7.3.4 Others
8 Submarine Communication Cable Market, By Offering (Page No. - 56)
8.1 Introduction
8.2 Installation & Commissioning
8.2.1 Submarine Communication Cable System Market in EMEA for Installation & Commissioning Projected to Grow at Highest CAGR From 2020 to 2025
8.3 Maintenance
8.3.1 Trans-Atlantic Region to Account for Largest Share of Submarine Communication Cable Market for Maintenance
8.4 Upgrades
8.4.1 Upgrades Segment of Submarine Communication Cable Market to Grow at Highest CAGR From 2020 to 2025
9 Submarine Power Cable Market, By Type (Page No. - 61)
9.1 Introduction
9.2 Single Core
9.2.1 Single Core Segment Projected to Lead Submarine Power Cable Market From 2020 to 2025
9.3 Multicore
9.3.1 Multicore Cables have Reduced Installation Costs as They Lay Complete Circuit in One Trench
10 Submarine Power Cable Market, By Voltage (Page No. - 64)
10.1 Introduction
10.2 Medium Voltage
10.2.1 Europe Held Largest Share of Medium Voltage Submarine Power Cable Market in 2019
10.3 High Voltage
10.3.1 Low Transmission Losses in High Voltage Submarine Power Cables Leading to Rise in Their Global Demand
11 Submarine Power Cable Market, By End User (Page No. - 67)
11.1 Introduction
11.2 Offshore Wind Power Generation
11.2.1 Increase in Use of Submarine Power Cables for Long Distance Power Transmissions From Offshore Wind Power Generation Plants
11.3 Inter-Country & Island Connection
11.3.1 Rise in Demand for Improved Power Supply to Islands Leading to Growth of Inter-Country & Island Connection Segment of Market
11.4 Offshore Oil & Gas
11.4.1 Increasing Subsea Operations and Deepwater Drilling Activities Driving Submarine Power Cable for Offshore Oil & Gas
12 Geographic Analysis of Submarine Communication Cable Market (Page No. - 71)
12.1 Introduction
12.2 Trans-Atlantic
12.2.1 Surging Requirement for Submarine Cable Capacity Enhancements Along North Trans-Atlantic Region Contributing to Growth of Submarine Communication Cable Market in Trans-Atlantic
12.3 Trans-Pacific
12.3.1 Rising Number of Activities to Connect Major Economic and Data Center Hubs in The Us, East Asia, and Southeast Asia Leading to Growth of Submarine Communication Cable Market in Trans-Pacific
12.4 Intra-Asia
12.4.1 Growing Contribution of Ott Players in Capacity Enhancements of Submarine Communication Cables of Intra-Asia to Lead to Growth of Market
12.5 Americas
12.5.1 Flourishing Mobile Data Market in Latin America to Fuel Growth of Submarine Communication Cable Market in Americas
12.6 Europe-Asia
12.6.1 Growing Adoption of Mobile and Cloud Combined With Recent Boost in Data Center Activities in Region to Lead to Growth of Market in Europe-Asia
12.7 EMEA
12.7.1 Increasing Annual Addition of Small Regional Submarine Communication Cable Systems to Contribute to Growth of Submarine Communication Cable Market in EMEA
13 Geographic Analysis of Submarine Power Cable Market (Page No. - 77)
13.1 Introduction
13.2 North America
13.2.1 US
13.2.1.1 Increase in Number Offshore Wind Projects and Demand for Enhancing Oil Output Contributing to Growth of Submarine Power Cable Market in US
13.2.2 Canada
13.2.2.1 Discovery of New Oil & Gas Reserves, Along With Upcoming Offshore Wind Generation Projects to Drive Growth of Submarine Power Cable Market in Canada
13.2.3 Mexico
13.2.3.1 Initiatives Undertaken By Government to Boost Oil Production to Contribute to Growth of Submarine Power Cable Market in Mexico
13.3 Europe
13.3.1 UK
13.3.1.1 Rise in Investments for Expanding The Total Installed Offshore Wind Capacity of Country Fueling Growth of Submarine Power Cable Market in UK
13.3.2 Germany
13.3.2.1 Government Initiatives and Technological Upgrades Taking Place in Offshore Wind Industry to Lead to Growth of Submarine Power Cable Market in Germany
13.3.3 Denmark
13.3.3.1 Increasing Adoption of New Technologies to Tap Undiscovered Oil & Gas Reserves Contributing to Growth of Submarine Power Cable Market in Denmark
13.3.4 Norway
13.3.4.1 Increased Investments in Planning & Development of New Offshore Wind Projects Leading to Growth of Submarine Power Cable Market in Norway
13.3.5 Netherlands
13.3.5.1 Government Initiatives and Schemes to Promote The Use of Sustainable Energy Fueling Growth of Submarine Power Cable Market in Netherlands
13.3.6 Rest of Europe
13.4 APAC
13.4.1 China
13.4.1.1 Planned Investments to Use Renewable Power Sources Expected to Contribute to Growth of Submarine Power Cable Market in China
13.4.2 Japan
13.4.2.1 Advanced R&D Activities Related to Offshore Wind Energy Generation to Contribute to Growth of Submarine Power Cable Market in Japan
13.4.3 South Korea
13.4.3.1 Rise in Offshore Wind Installations in South Korea to Contribute to Growth of Submarine Power Cable Market in Country
13.4.4 Malaysia
13.4.4.1 Initiatives Undertaken By The Government to Increase Aggregate Oil, Gas, and Energy Production Capacity of Indonesia to Lead to Market Growth From 2020 to 2025
13.4.5 Indonesia
13.4.5.1 Increased Investments for Intercountry Grid Connections in Indonesia to Fuel Growth of Submarine Power Cable Market in Country
13.4.6 Rest of APAC
13.5 Middle East & Africa
13.5.1 UAE
13.5.1.1 UAE Projected to Account for The Second-Largest Size of Submarine Power Cable Market in Middle East & Africa From 2020 to 2025
13.5.2 Saudi Arabia
13.5.2.1 Submarine Power Cable Market in Saudi Arabia Projected to Grow at Highest CAGR From 2020 to 2025
13.5.3 Angola
13.5.3.1 Rise in Number of Offshore Oil & Gas Exploration Activities to Lead to Growth of Submarine Power Cable Market in Angola
13.5.4 Rest of Middle East & Africa
13.6 South America
13.6.1 Brazil
13.6.1.1 Emergence of Brazil as Promising Market for Wind Energy Fueling Growth of Submarine Power Cable Market in Country
13.6.2 Argentina
13.6.2.1 New Offshore Oil & Gas Exploration & Production Activities and Significant Investments in Grid Interconnections Contributing to Growth of Submarine Power Cable Market in Argentina
13.6.3 Rest of America
14 Competitive Landscape (Page No. - 102)
14.1 Introduction
14.2 Ranking Analysis of Key Players in Submarine Cable System Market
14.3 Competitive Situations and Trends
14.3.1 Contracts, Agreements & Partnerships
14.3.2 Acquisitions
14.3.3 Product Launches
15 Company Profiles (Page No. - 107)
15.1 Key Players
15.1.1 Alcatel-Lucent
15.1.1.1 Business Overview
15.1.1.2 Products/Services/Solutions Offered
15.1.1.3 Recent Developments
15.1.1.4 SWOT Analysis
15.1.1.5 MnM View
15.1.2 Subcom
15.1.2.1 Business Overview
15.1.2.2 Products/Services/Solutions Offered
15.1.2.3 Recent Developments
15.1.2.4 SWOT Analysis
15.1.2.5 MnM View
15.1.3 NEC
15.1.3.1 Business Overview
15.1.3.2 Products/Services/Solutions Offered
15.1.3.3 Recent Developments
15.1.3.4 SWOT Analysis
15.1.3.5 MnM View
15.1.4 Prysmian
15.1.4.1 Business Overview
15.1.4.2 Products/Services/Solutions Offered
15.1.4.3 Recent Developments
15.1.4.4 SWOT Analysis
15.1.4.5 MnM View
15.1.5 Nexans
15.1.5.1 Business Overview
15.1.5.2 Products/Services/Solutions Offered
15.1.5.3 Recent Developments
15.1.5.4 SWOT Analysis
15.1.5.5 MnM View
15.1.6 Google
15.1.6.1 Business Overview
15.1.6.2 Products/Services/Solutions Offered
15.1.6.3 Recent Developments
15.1.7 Saudi Ericsson
15.1.7.1 Business Overview
15.1.7.2 Products/Services/Solutions Offered
15.1.8 Hengtong
15.1.8.1 Business Overview
15.1.8.2 Products/Services/Solutions Offered
15.1.8.3 Recent Developments
15.1.9 ZTT
15.1.9.1 Business Overview
15.1.9.2 Products/Services/Solutions Offered
15.1.9.3 Recent Developments
15.1.10 NKT
15.1.10.1 Business Overview
15.1.10.2 Products/Services/Solutions Offered
15.1.10.3 Recent Developments
15.2 Other Key Players
15.2.1 Corning Inc.
15.2.2 Cablel Group
15.2.3 Hesfibel
15.2.4 JDR Cable Systems LTD.
15.2.5 Okonite
15.3 Key Innovators
15.3.1 Apar Industries LTD.
15.3.2 AFL
15.3.3 Tele-Fonika Kable (Tf Kable)
15.3.4 Hexatronic Cables & Interconnect Systems
15.3.5 Leoni Special Cables GmbH
16 Appendix (Page No. - 143)
16.1 Insights of Industry Experts
16.2 Discussion Guide
16.3 Knowledge Store: Marketsandmarkets’ Subscription Portal
16.4 Available Customizations
16.5 Related Reports
16.6 Author Details
The study involved four major activities for estimating the current market size of the submarine cable system market. Exhaustive secondary research was conducted to collect information on the market, as well as its peer and parent markets. The next step involved the validation of these findings, assumptions, and sizing with industry experts across the value chain, i.e., through primary research. Both top-down and bottom-up approaches were employed to estimate the overall market size. Thereafter, market breakdown and data triangulation were used to estimate the market size of segments and subsegments.
Secondary Research
In the secondary research process, various secondary sources have been referred to for identifying and collecting information important for this study. These secondary sources include the European Subsea Cables Associations (ESCA), the North American Submarine Cable Associations (NASCA); WindEurope, Submarine Telecom Forums, journals; press releases and financials of companies; white papers and certified publications and articles from recognized authors; directories; and databases.
Primary Research
In the primary research process, various primary sources from both supply and demand sides have been interviewed to obtain qualitative and quantitative information important for this report. Primary sources from the supply side include industry experts such as CEOs, VPs, marketing directors, technology and innovation directors, and related executives from key companies and organizations operating in the submarine cable system market. After complete market engineering (including calculations regarding market statistics, market breakdown, market size estimations, market forecasting, and data triangulation), extensive primary research has been conducted to gather information, as well as verify and validate the critical numbers arrived at.
Market Size Estimation
In the complete market engineering process, both top-down and bottom-up approaches have been implemented, along with several data triangulation methods, to estimate and validate the size of the submarine cable system market and other dependent submarkets listed in this report.
- Key players in the industry and markets have been identified through extensive secondary research.
- The industry’s supply chain and market size, in terms of value, have been determined through primary and secondary research processes.
- All percentage shares, splits, and breakdowns have been determined using secondary sources and verified through primary sources.
Data Triangulation
After arriving at the overall market size from the estimation process explained above, the global submarine cable system market has been split into several segments and subsegments. To complete the overall market engineering process and arrive at exact statistics for all segments and subsegments, market breakdown and data triangulation procedures have been employed, wherever applicable. The data have been triangulated by studying various factors and trends related to different verticals, identified from both demand and supply sides. Along with this, the market size has been validated using both top-down and bottom-up approaches.
The following are the major objectives of the study.
- To describe and forecast the submarine cable system market, by application, in terms of value
- To describe and forecast the submarine communication cable market, by application, in terms of value, based on component and offering
- To describe and forecast the submarine power cable market, by application, in terms of value, based end user, voltage, and type
- To describe and forecast the submarine communication cable market for various segments with regard to six main regions— Trans-Atlantic, Trans-Pacific, Intra-Asia, the Americas, Europe-Asia, and EMEA, in terms of value
- To describe and forecast the submarine power cable market for various segments with regard to 5 main regions— North America, Europe, Asia Pacific (APAC), the Middle East & Africa, and South America, in terms of value
- To provide detailed information about the drivers, restraints, opportunities, and challenges that influence the growth of the submarine cable system market
- To analyze micromarkets1 with respect to individual growth trends, prospects, and contribution to the overall market
- To analyze the market opportunities for various stakeholders by identifying the high-growth segments of the submarine cable system market
- To profile key players and comprehensively analyze their market positions—in terms of ranking and core competencies2, along with detailed competitive landscape for the market leaders
- To analyze competitive developments such as contracts, agreements, acquisitions, product launches, and partnerships in the submarine cable system market

Published On: Jan - 2021
Single User
US$ 4500*** Benefits ***
1. 15% Free customization
2. Two Countries can add as per your choice
3. Two Company can add as per your choice
4. 35+ Countries
*** Services ***
1. Quarterly Industry Update for Six Months
2. One personal Research Analyst Allocate to you
3. 24*7 Research Support
4. Query will be resolve with 48 hours
Multi User
US$ 5250*** Benefits ***
1. 25% Free customization
2. Excel Data Sheet
3. Two Countries can add as per your choice
4. Two Company can add as per your choice
35+ Countries
*** Services ***
1. Client will get one updated report for a year.
2. Quarterly Industry Update for 1 Year.
3. One research analyst will allocate to you.
4. Query will be resolved within 36 hours.
24*7 Research Support.
Corporate User
US$ 7000*** Benefits ***
1. 25% Free customization
2. Excel Data Sheet
3. Two Countries can add as per your choice
4. Two Company can add as per your choice
5. 35+ Countries
*** Services ***
1. Client will get one updated report for a year.
2. Quarterly Industry Update for 1 Year.
3. One research analyst will allocate to you.
4. Query will be resolved within 36 hours.
5. 24*7 Research Support.
INDUSTRIES
Aerospace and Defence Agriculture Automotive Services Consumer Goods Energy and Power Food And Beverages Industry Services IT And Telecommunications Manufacturing and Construction Chemicals And Materials Medical Devices Healthcare And Pharmaceuticals Semiconductor And ElectronicsQUICK LINKS
About Us Press Releases Blogs Become a Reseller Privacy Policy Disclaimer Terms and Conditions Sitemap
